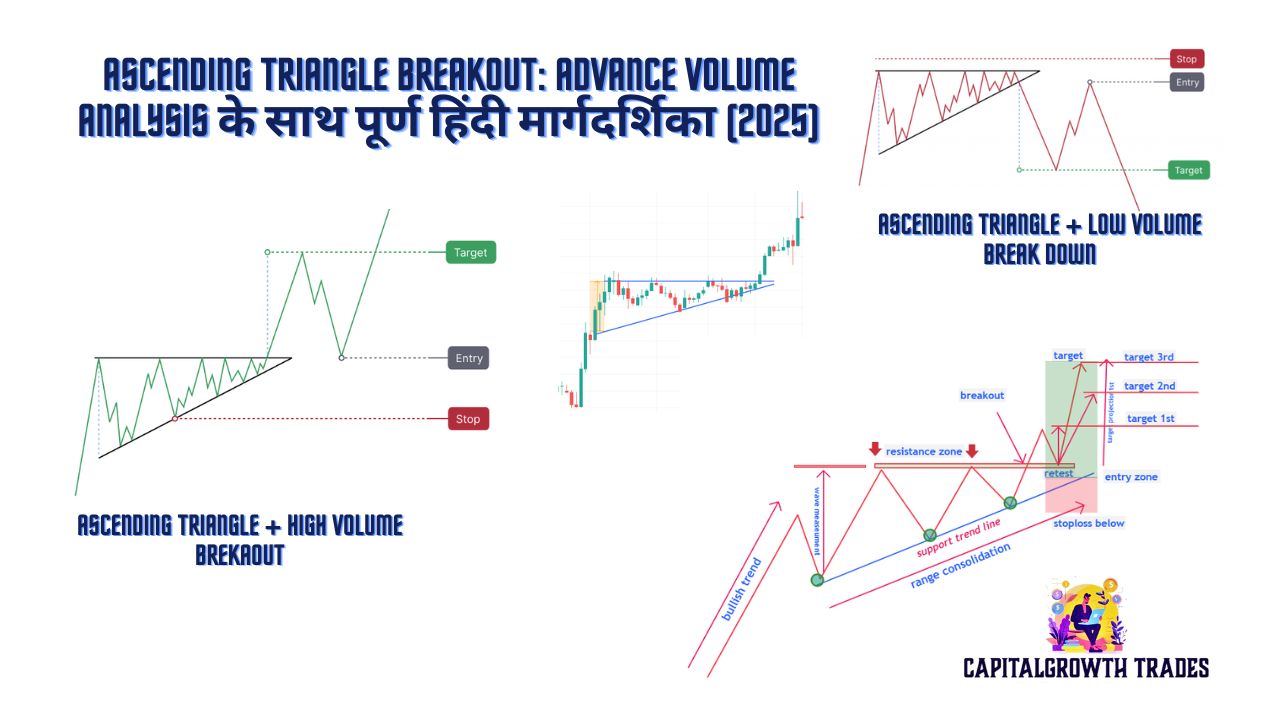
Ascending Triangle + High Volume Breakout क्या होता है?

Ascending Triangle Breakout pattern के साथ high volume chart हिंदी में

Ascending Triangle Pattern क्या होता है? Ascending Triangle Pattern एक bullish continuation chart pattern है, जो दर्शाता है कि price consolidate हो रहा है लेकिन buyers की ताकत धीरे-धीरे बढ़ रही है। इस pattern में …

Read more

Ascendin Triangle Breakout: Advance Volume Analysis के साथ पूर्ण हिंदी मार्गदर्शिका (2025)

Ascending Triangle Chart Pattern का विश्लेषण — एक साइड में High Volume Breakout और दूसरी साइड में Low Volume False Breakout

Ascending Triangle Breakout क्या है? Advance Volume Analysis के साथ पूरी जानकारीसीखिए Ascending Triangle Breakout Pattern को पहचानना, Volume Analysis करना, और सफल ट्रेडिंग की रणनीतियाँ अपनाना। प्रस्तावना (Intro) Stock Market की दुनिया में हर …

Read more

Bearish Pennant Pattern in Hindi: शेयर बाजार में गिरावट पहचानने का सटीक तरीका

bearish pennant pattern

Bearish Pennant Pattern in Hindi में जानें यह पैटर्न क्या होता है, चार्ट पर इसे कैसे पहचानें, इसका मनोविज्ञान, और इसका उपयोग कर आप शॉर्ट ट्रेडिंग में कैसे लाभ उठा सकते हैं। एक कम्पलीट हिंदी …

Read more

Bullish Pennant Pattern: टेक्निकल एनालिसिस में एक मजबूत संकेत

continuation pattern

Bullish Pennant Pattern क्या है? पहचानें, ट्रेड करें और मुनाफा कमाएं। Bullish Pennant Pattern एक ताकतवर चार्ट पैटर्न है जो प्राइस में तेजी का संकेत देता है। जानिए इसे कैसे पहचानें, इसका टेक्निकल एनालिसिस और …

Read more