Live Crypto Charts
Monitor real-time crypto market trends here
Market Sentiment (Fear & Greed Index)
Trending Coins
Latest Crypto News
Ethereum में जबरदस्त गिरावट! क्या $800 से होगी अगली बड़ी क्रिप्टो रैली?
रिपोर्ट: 19 अप्रैल 2025 | Capital Growth Trades न्यूज़ डेस्क
क्रिप्टोकरेंसी बाजार एक बार फिर उथल-पुथल के दौर से गुजर रहा है। दुनिया की दूसरी सबसे बड़ी क्रिप्टोकरेंसी Ethereum (ETH) की कीमतों में हाल ही में जबरदस्त गिरावट देखने को मिली है। शुक्रवार को ETH $1,600 के नीचे फिसल गया, जिससे बाजार में डर का माहौल बन गया है।
हालांकि इस गिरावट में भी जानकारों और चार्ट विश्लेषकों को अवसर की झलक दिख रही है। तकनीकी संकेत और वॉल्यूम डेटा यह बताते हैं कि Ethereum एक महत्वपूर्ण सपोर्ट ज़ोन की ओर बढ़ रहा है, जहां से संभावित बड़ी तेजी की शुरुआत हो सकती है। क्या Ethereum $800 से अगली बुल रैली शुरू कर सकता है? आइए जानते हैं ताज़ा विश्लेषण।
Ethereum का ताज़ा साप्ताहिक चार्ट यह संकेत देता है कि क्रिप्टोकरेंसी एक मजबूत डाउनट्रेंड में है। पिछले सपोर्ट स्तर $2,500 के टूटने के बाद Ethereum सीधे $1,600 से नीचे आ गया है। चार्ट पर देखा जा सकता है कि Ethereum इस समय एक Bearish Trend Channel के अंदर गिर रहा है, जिसमें तेजी से गिरावट जारी है।

Ethereum का प्राइस अब उस अनबैलेंस्ड ज़ोन में प्रवेश कर चुका है, जहां पहले यह बिना ज्यादा रुकावट के ऊपर गया था। अब वही ज़ोन उल्टी दिशा में काम कर रहा है — प्राइस बिना रुकावट नीचे गिर रहा है। आने वाले दिनों में $1,200 और फिर $800–$1,000 का ज़ोन अगला संभावित सपोर्ट बन सकता है, जिसे एक्सपर्ट्स लॉन्ग टर्म Accumulation Zone मानते हैं।
इस गिरावट के दौरान वॉल्यूम में तेजी देखी गई है, जो संकेत देता है कि बड़े निवेशक यानी Smart Money, इस गिरावट में खरीदारी कर रहे हैं। यह पैटर्न पहले भी 2022 में देखा गया था, जब Ethereum $880 से उछल कर $4,000 से ऊपर चला गया था। मार्केट का इतिहास बताता है कि जब भी बड़े निवेशक डर के समय खरीदारी करते हैं, तब अगली बुल रैली जन्म लेती है।
तकनीकी संकेतक जैसे RSI (Relative Strength Index) भी इस समय ओवरसोल्ड ज़ोन में है, जो संभावित बाउंस या ट्रेंड रिवर्सल का शुरुआती संकेत दे रहा है। अगर Ethereum $800–$1,000 के ज़ोन में स्थिर होता है और वहां कुछ सप्ताह टिकता है, तो यहां से $2,500 और फिर $4,400 तक का मूव आ सकता है।
क्रिप्टो एक्सपर्ट्स की राय में Ethereum के लिए $800 का स्तर लॉन्ग टर्म निवेशकों के लिए एक सुनहरा अवसर हो सकता है। कई जानकार मानते हैं कि यह वो क्षेत्र है जहां से Ethereum एक बार फिर नई बुल रैली शुरू कर सकता है। वर्ष 2022 में भी Ethereum ने इसी स्तर से पलटकर कई गुना रिटर्न दिया था।
निवेशकों के लिए यह समय घबराने का नहीं, बल्कि रणनीति के साथ सोचने का है। अगर Ethereum $800 के करीब आता है, तो वहां से धीरे-धीरे निवेश शुरू करना एक समझदारी भरा कदम हो सकता है। हालांकि हर स्टेप पर रिस्क मैनेजमेंट, स्टॉप लॉस और सही जानकारी जरूरी है। इसीलिए DYOR (Do Your Own Research) की नीति को ज़रूर अपनाएं।
Ethereum की गिरावट भले ही डरावनी हो, लेकिन इतिहास और तकनीकी विश्लेषण बार-बार यही कहते हैं कि बड़ी तेजी हमेशा बड़ी गिरावटों के बाद ही आती है। यदि Ethereum $800–$1,000 के ज़ोन में मजबूत आधार बना पाता है, तो यह आने वाली बुल रैली का शुरुआती बिंदु साबित हो सकता है।
Capital Growth Trades हिंदी में हर दिन ताज़ा टेक्निकल एनालिसिस, लाइव चार्ट्स, निवेश टिप्स और क्रिप्टो से जुड़ी बड़ी खबरें देता है। जुड़े रहिए, सीखते रहिए और समझदारी से निवेश कीजिए।
Solana (SOL) Price Prediction 2025: Can Bulls Push Past $255?
Overview
Solana (SOL) has been gaining momentum in the crypto market, with recent price action suggesting a potential breakout from key resistance zones. In this analysis, we break down Solana’s current market structure using technical indicators, supply-demand zones, and price projection patterns, alongside relevant news updates to help US-based traders make informed decisions.
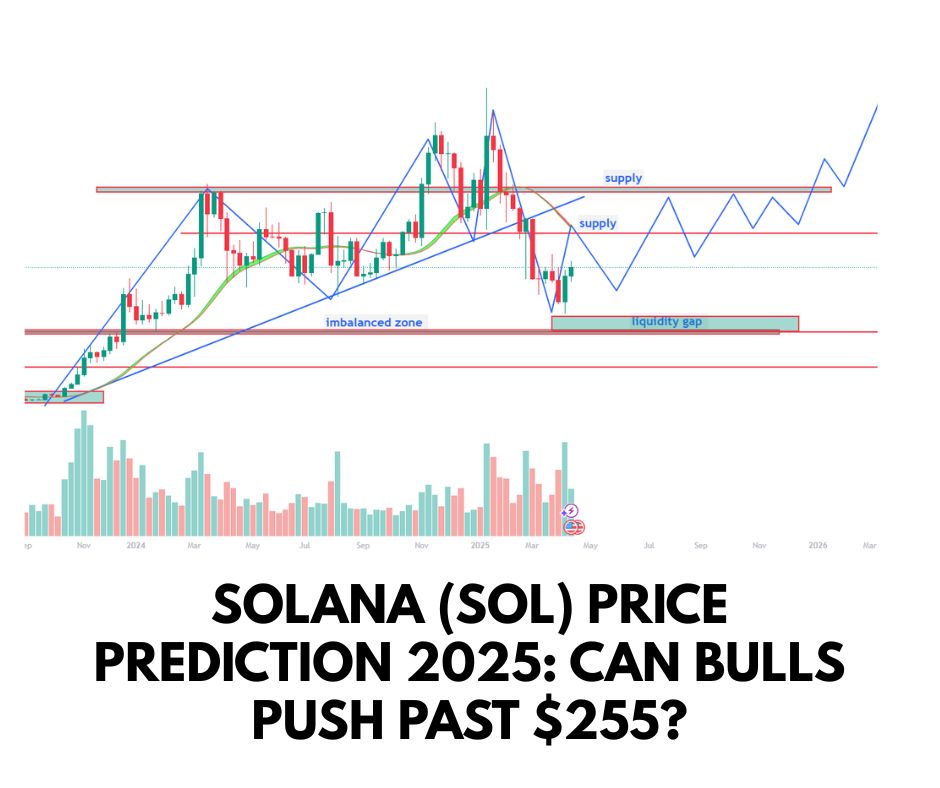
Solana Technical Analysis – Daily Timeframe (Chart Overview)
Key Observations from the Chart:
• Current Price: $136.62
• Short-Term Trend: Bullish (higher highs and higher lows forming)
• Immediate Resistance: Around $153–$155 (near supply zone)
• Major Support: $122.35 and the high-demand zone near $73.25
• Projection Path: Strong ascending trendline with consolidation breakouts forecasted toward $200+
• Target Zones:
- Intermediate: $180 – $200
- Long-Term: $255.26 and $293.02
Supply Zone Alert:
SOL is currently approaching a critical supply zone near $150–$155. If it breaks and sustains above this level, it could pave the way toward $200+ targets in Q2–Q3 of 2025.
Bullish Projection Path
The projected pattern in the image shows a potential cup-and-handle-like formation, forming a bullish base. The breakout confirmation above the $155 level will likely trigger a parabolic move, especially if accompanied by high volume and positive macroeconomic sentiment in the crypto sector.
Recent Solana News & Updates (April 2025)
1. Solana Sees Increased Developer Activity
According to a recent report from CryptoSlate, Solana now leads in weekly GitHub commits among all L1 blockchains, suggesting growing ecosystem adoption.
2. Institutional Inflows Rising
Per CoinDesk, US-based institutional investors are showing renewed interest in Solana via ETFs and futures products, contributing to increased liquidity and bullish sentiment.
3. Solana’s NFT Ecosystem Expansion
Solana’s NFT platforms like Magic Eden and Tensor continue to thrive, gaining traction over Ethereum-based platforms due to lower gas fees and faster settlement.
Why Solana Could Be a Strong Bet in 2025
✅ High Throughput & Low Fees
✅ Growing Institutional Confidence
✅ Strong Technical Setup
✅ Expanding Developer Ecosystem
✅ Resilient User Base Despite Bearish Phases
Risks to Watch
❌ Macroeconomic volatility in US markets
❌ Potential regulatory pushback by SEC or Congress
❌ Network outages (though reduced in 2025)
📅 April–June 2025 Outlook: What’s Next?
| Zone | Price Range | Signal |
|---|---|---|
| High Demand Zone | $70–$80 | Strong Buy Zone |
| Accumulation Range | $122–$136 | Neutral to Bullish |
| Supply Zone | $150–$155 | Breakout Watch |
| Target 1 | $180–$200 | Swing Trade Zone |
| Target 2 | $255–$293 | Long-Term Investment |
🔧 Strategy for Traders
🟢 Entry Zone: On retest of $124–$128 with volume confirmation
🟡 Breakout Buy: Above $155 with stop-loss at $135
🔴 Avoid FOMO: If price goes parabolic without consolidation
🎯 Final Thoughts
With a clear technical uptrend and strong fundamentals, Solana looks poised for a bullish breakout in the coming weeks. Traders and investors should watch the $155 resistance level closely. A sustained move above this could fuel a rally toward $200 and beyond, making SOL one of the top altcoin performers in 2025.
📣 Stay Updated:
Subscribe to our YouTube channel “Capital Growth” for daily technical updates, crypto news, and live analysis.
🔗 Watch Now – Solana Price Update & Technical Breakdown